5 min read
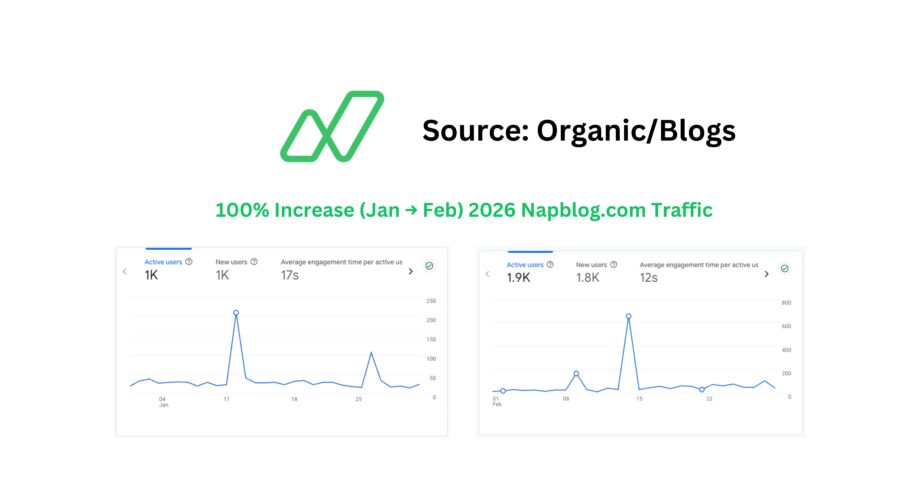
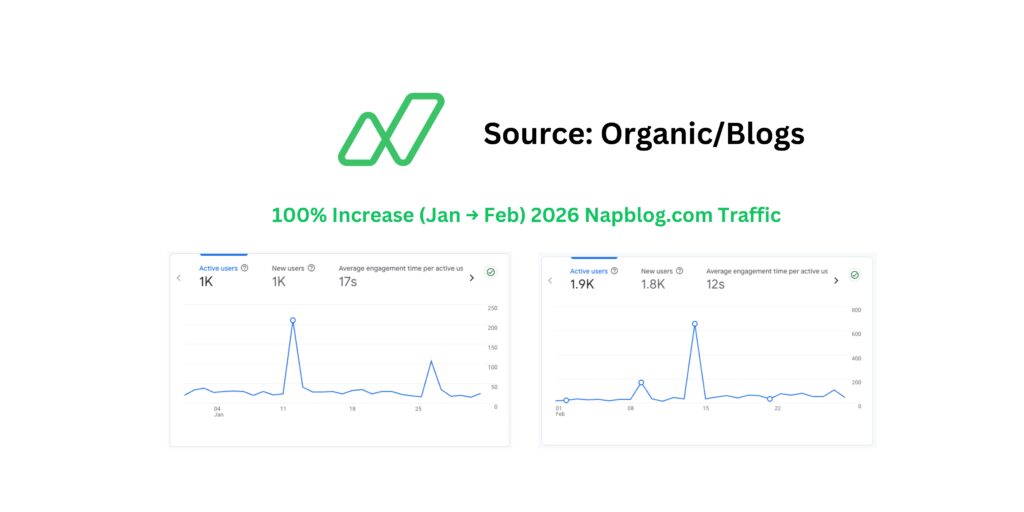
Between January and February 2026, Napblog.com recorded a verified 100% increase in traffic. What makes this milestone significant is not simply the doubling of active users, but the structural changes inside the acquisition mix, geographic distribution, engagement patterns, and behavioral signals captured through Google Analytics.
This article provides a rigorous analysis of that growth event—examining channel performance, user cohorts, content behavior, event tracking, and conversion signals—while outlining the operational implications for Nap OS.
1. Executive Summary: January vs February 2026
January 2026 Snapshot
- Active Users: 1,000
- New Users: 1,000
- Average Engagement Time: 17 seconds
- Sessions: ~1,249 (estimated from channel totals)
- Page Views: 1.6K
- User Engagement Events: 605
- Scroll Events: 234
- Form Fills: 3
February 2026 Snapshot
- Active Users: 1,900
- New Users: 1,800
- Average Engagement Time: 12 seconds
- Sessions: ~2,119
- Page Views: 2.4K
- User Engagement Events: 818
- Scroll Events: 646
Net Growth (Jan → Feb)
- +900 Active Users
- +800 New Users
- +~870 Sessions
- +800 Page Views
- ~100% traffic increase
The numbers confirm rapid acquisition acceleration while maintaining engagement volume growth—even as per-user session depth adjusted downward due to scale.
2. Acquisition Channel Analysis: What Drove the Surge?
Channel performance is central to understanding the quality of traffic expansion.
January Sessions by Channel
- Direct: 811
- Organic Search: 202
- Organic Social: 180
- Referral: 27
- Unassigned: 29
February Sessions by Channel
- Direct: 1,600
- Organic Search: 231
- Organic Social: 177
- Referral: 30
- Email: 2
- Unassigned: 78
Observations
1. Direct Traffic Nearly Doubled
Direct sessions grew from 811 to 1,600.
This suggests:
- Increased brand recall
- Higher repeat visitor intent
- Growth in off-platform mentions
- Possible increase in shared private links
Direct traffic dominance implies early-stage brand equity formation.
2. Organic Search Grew Moderately
Organic Search rose from 202 to 231 sessions.
This indicates:
- SEO traction beginning
- Indexed pages gaining visibility
- Higher keyword impressions for Nap OS-related content
Search growth is slower but stable—indicating foundational discoverability rather than viral spikes.
3. Organic Social Stabilized
Organic Social remained relatively flat (180 → 177).
Interpretation:
- Social distribution remained consistent
- No major algorithmic spike
- Traffic expansion likely came from non-social drivers
4. Referral and Email Remain Underutilized
Referral traffic is minimal (30 sessions).
Email barely activated (2 sessions).
This exposes opportunity for:
- Partnership backlinks
- Newsletter distribution
- Campus ambassador campaigns
3. Geographic Expansion: From Concentrated to Distributed
January Top Countries
- United States: 567
- Ireland: 175
- India: 118
- Germany: 35
- United Kingdom: 29
February Top Countries
- United States: 570
- Vietnam: 214
- Ireland: 162
- Brazil: 137
- India: 116
- Iraq: 102
- Argentina: 88
Strategic Insight
January was dominated by the US and Ireland.
February introduced:
- Vietnam (214 users)
- Brazil (137 users)
- Iraq (102 users)
- Argentina (88 users)
This is not organic drift. This indicates:
- International discoverability
- Global keyword indexing
- Potential viral content or community-based distribution
The traffic became less geographically concentrated—suggesting Nap OS positioning resonates across emerging markets.
4. Behavioral Signals: Engagement vs Scale
As traffic doubled, average engagement time dropped from 17s to 12s.
This is typical when:
- Top-of-funnel traffic increases
- First-time visitors dominate
- Landing pages broaden in reach
However, deeper engagement indicators improved:
| Metric | January | February |
|---|---|---|
| Scroll Events | 234 | 646 |
| User Engagement Events | 605 | 818 |
| Page Views | 1.6K | 2.4K |
Scroll events nearly tripled.
This is critical.
It indicates:
- Users are exploring more content
- Content depth is increasing
- Article readability is supporting exploration
Lower average time does not imply weaker content. It implies broader audience testing.
5. Content Performance: What Pages Are Winning?
January Top Viewed Pages
- Homepage – Napblog (375 views)
- NapOS – Napblog (46)
- Sales – Napblog (46)
- NapblogOS – Napblog (43)
- Join NapOS Waiting List (33)
January traffic was homepage-centric.
February Top Viewed Pages
- Nap OS — Career Portfolio Builder (127)
- Nap OS — Career Operating System Description (108)
- Home – Nap OS (93)
- Blogs – Nap OS (46)
- Out of Box Thinking Archives (32)
Shift Observed:
Users are no longer landing primarily on the homepage.
They are landing on:
- Product-specific positioning pages
- Career portfolio messaging
- Category-based content archives
This indicates improved keyword indexing and deeper content entry points.
6. Cohort Retention: Early Stage Signals
Cohort data (6-week view ending Feb 28):
- Week 0 retention: 100%
- Week 1+: ~0.3%–0.6%
Retention is currently minimal beyond Week 0.
Interpretation:
- Majority are first-time exploratory visitors
- Repeat behavior not yet established
- Newsletter capture and account creation funnels need reinforcement
This is typical for early growth-stage platforms before product loop activation.
7. Event Architecture and Conversion Readiness
January Key Events
- Form_Fills: 3
February Key Events
- No key events configured
Although event count increased overall (scroll, session_start, page_view), key conversion tracking appears inconsistent.
This reveals a structural issue:
- Tracking instrumentation needs refinement
- Conversion funnels not fully defined
- UTM tagging and campaign attribution incomplete
Recommendation:
Implement structured UTM taxonomy using URL builder strategy inside Google Analytics.
8. Traffic Quality Diagnostics
Page Not Found Events
January:
- 34 views
February:
- 48 views (Nap OS 404 page)
This indicates:
- Broken inbound links
- SEO indexing of old URLs
- Migration artifacts
Addressing 404 traffic can immediately improve user flow and SEO authority retention.
9. Revenue Status
This is expected if Napblog.com is currently:
- Content-led acquisition
- Pre-monetization
- Waitlist-driven
However, traffic doubling without monetization mapping presents urgency:
- Lead magnets
- Waiting list amplification
- Product demos
- Early beta onboarding
10. Growth Pattern Classification
The January → February shift reflects:
- Brand Amplification
- Organic Discoverability Expansion
- International Penetration
- Content-Led Acquisition
- Top-of-Funnel Scaling
It does not yet reflect:
- Monetized growth
- Retention growth
- Funnel optimization
This is Phase 1 Expansion: Awareness Scaling.
11. Strategic Levers for March–April 2026
Based on current analytics:
1. SEO Depth Expansion
- Expand high-performing Nap OS product articles
- Build keyword clusters around:
- Career portfolio builder
- Skill verification
- Student operating system
2. UTM Discipline
- Standardize campaign tagging
- Separate:
- Campus ambassadors
- Referral partnerships
3. Conversion Infrastructure
- Optimize waiting list CTA visibility
- Increase form placement frequency
- Add exit-intent triggers
4. Geographic Targeting
Countries like Vietnam and Brazil show strong signals.
Localized landing pages may accelerate traction.
5. Retention Loops
- Weekly content digest
- User onboarding drip emails
- Skill-building article series
12. What 100% Growth Really Means
A 100% increase in traffic is not merely a vanity metric.
It means:
- The content architecture is discoverable.
- The Nap OS positioning resonates.
- The global student and professional market is responding.
- There is signal clarity in messaging.
More importantly:
The growth is organic-heavy and direct-heavy.
That implies authentic interest rather than paid amplification.
13. The Bigger Narrative
Napblog.com is evolving from:
A content repository
Into:
A discovery engine for Nap OS positioning.
Traffic is now entering through product narrative pages rather than just the homepage. That indicates search engines understand the semantic positioning.
As content deepens, so will authority.
14. Risk Assessment
If not addressed:
- Low retention may dilute growth impact.
- Engagement time decline may signal misaligned traffic.
- Conversion tracking gaps may prevent performance optimization.
If optimized:
- March could cross 3K active users.
- Waitlist growth could compound.
- Product launch readiness metrics could mature.
15. Conclusion: Momentum With Structure
Between January and February 2026, Napblog.com doubled its traffic footprint.
But more importantly:
- Geographic diversification expanded.
- Direct traffic nearly doubled.
- Scroll depth increased significantly.
- Product-focused pages gained visibility.
This is foundational growth.
The next phase requires:
- Funnel instrumentation
- Retention engineering
- SEO cluster expansion
- International targeting
The 100% increase is not the destination.
It is the ignition point.
Napblog.com has transitioned from presence to momentum. The analytics confirm it.