NapOS
Insights, updates, and deep dives into the Nap OS platform â the career execution operating system built for students, freelancers, and founders.
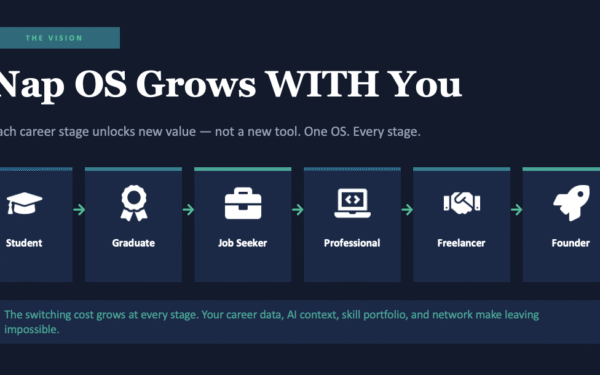
Nap OS: Structural AI Execution and Portfolio Intelligence Across Career Stages
The traditional idea of a career has collapsed.For decades, individuals progressed through predictable phases — education, employment, advancement…
Nap OS ->Rewiring Hiring Beyond the Resume Economy
The hiring system most of the world still operates on was built for an industrial era that no…

Evidential Skill-Based Hiring: The Nap OS Perspective on Moving Beyond the Resume
For decades, hiring systems were designed around a document — the resume.A compressed narrative of education, past affiliations,…

What Employers Actually Want to See And How Nap OS Is Built Around It.
The global hiring landscape has changed more in the past five years than in the previous twenty. Entry-level…
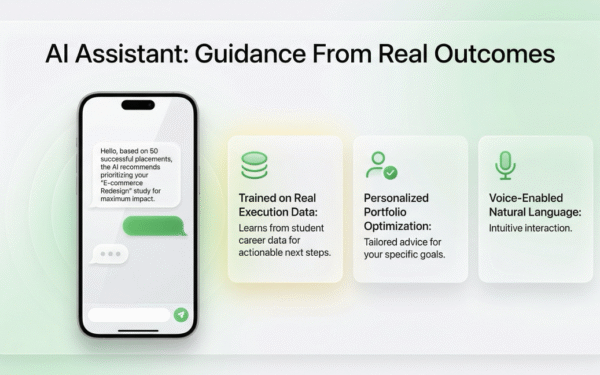
Nap OS AI Assistant: Intelligent Chat and Voice Your Cognitive Co-Pilot
The interface to intelligence is changing. Over the last few years, platforms such as OpenAI’s ChatGPT have normalized…

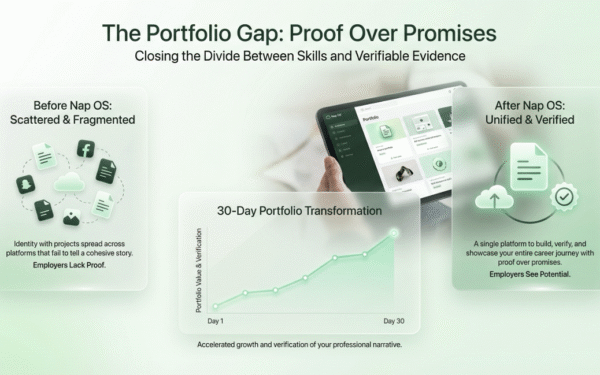
From Portfolio Gap to Offer Letter: The Real Outcomes of Using Nap OS
The job market has structurally changed. Degrees are no longer differentiators. Certificates are everywhere. Bootcamps are saturated. AI…
Turn knowledge into execution
These articles come from real experience inside Nap OS. Start building your own verified skills today.
Try Nap OS Free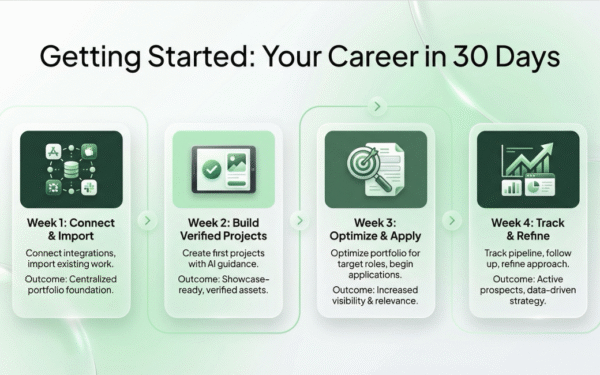
Getting Started: Your Career in 30 Days with Nap OS
The labor market has structurally changed. Entry-level roles are shrinking. Internships are more competitive. AI has compressed the…
The Entry-Level Collapse Is Real. Portfolios and Leadership Are the New Currency. Here’s Why You Must Start Using Nap OS Now.
For decades, the career path was predictable: University → Internship → Entry-Level Job → Promotion → Leadership. That…
Nap OS, The operating system for humans who direct AI, not depend on it.
Why Nap OS Exists? We’re living through the biggest shift in human capability since the industrial revolution. AI…
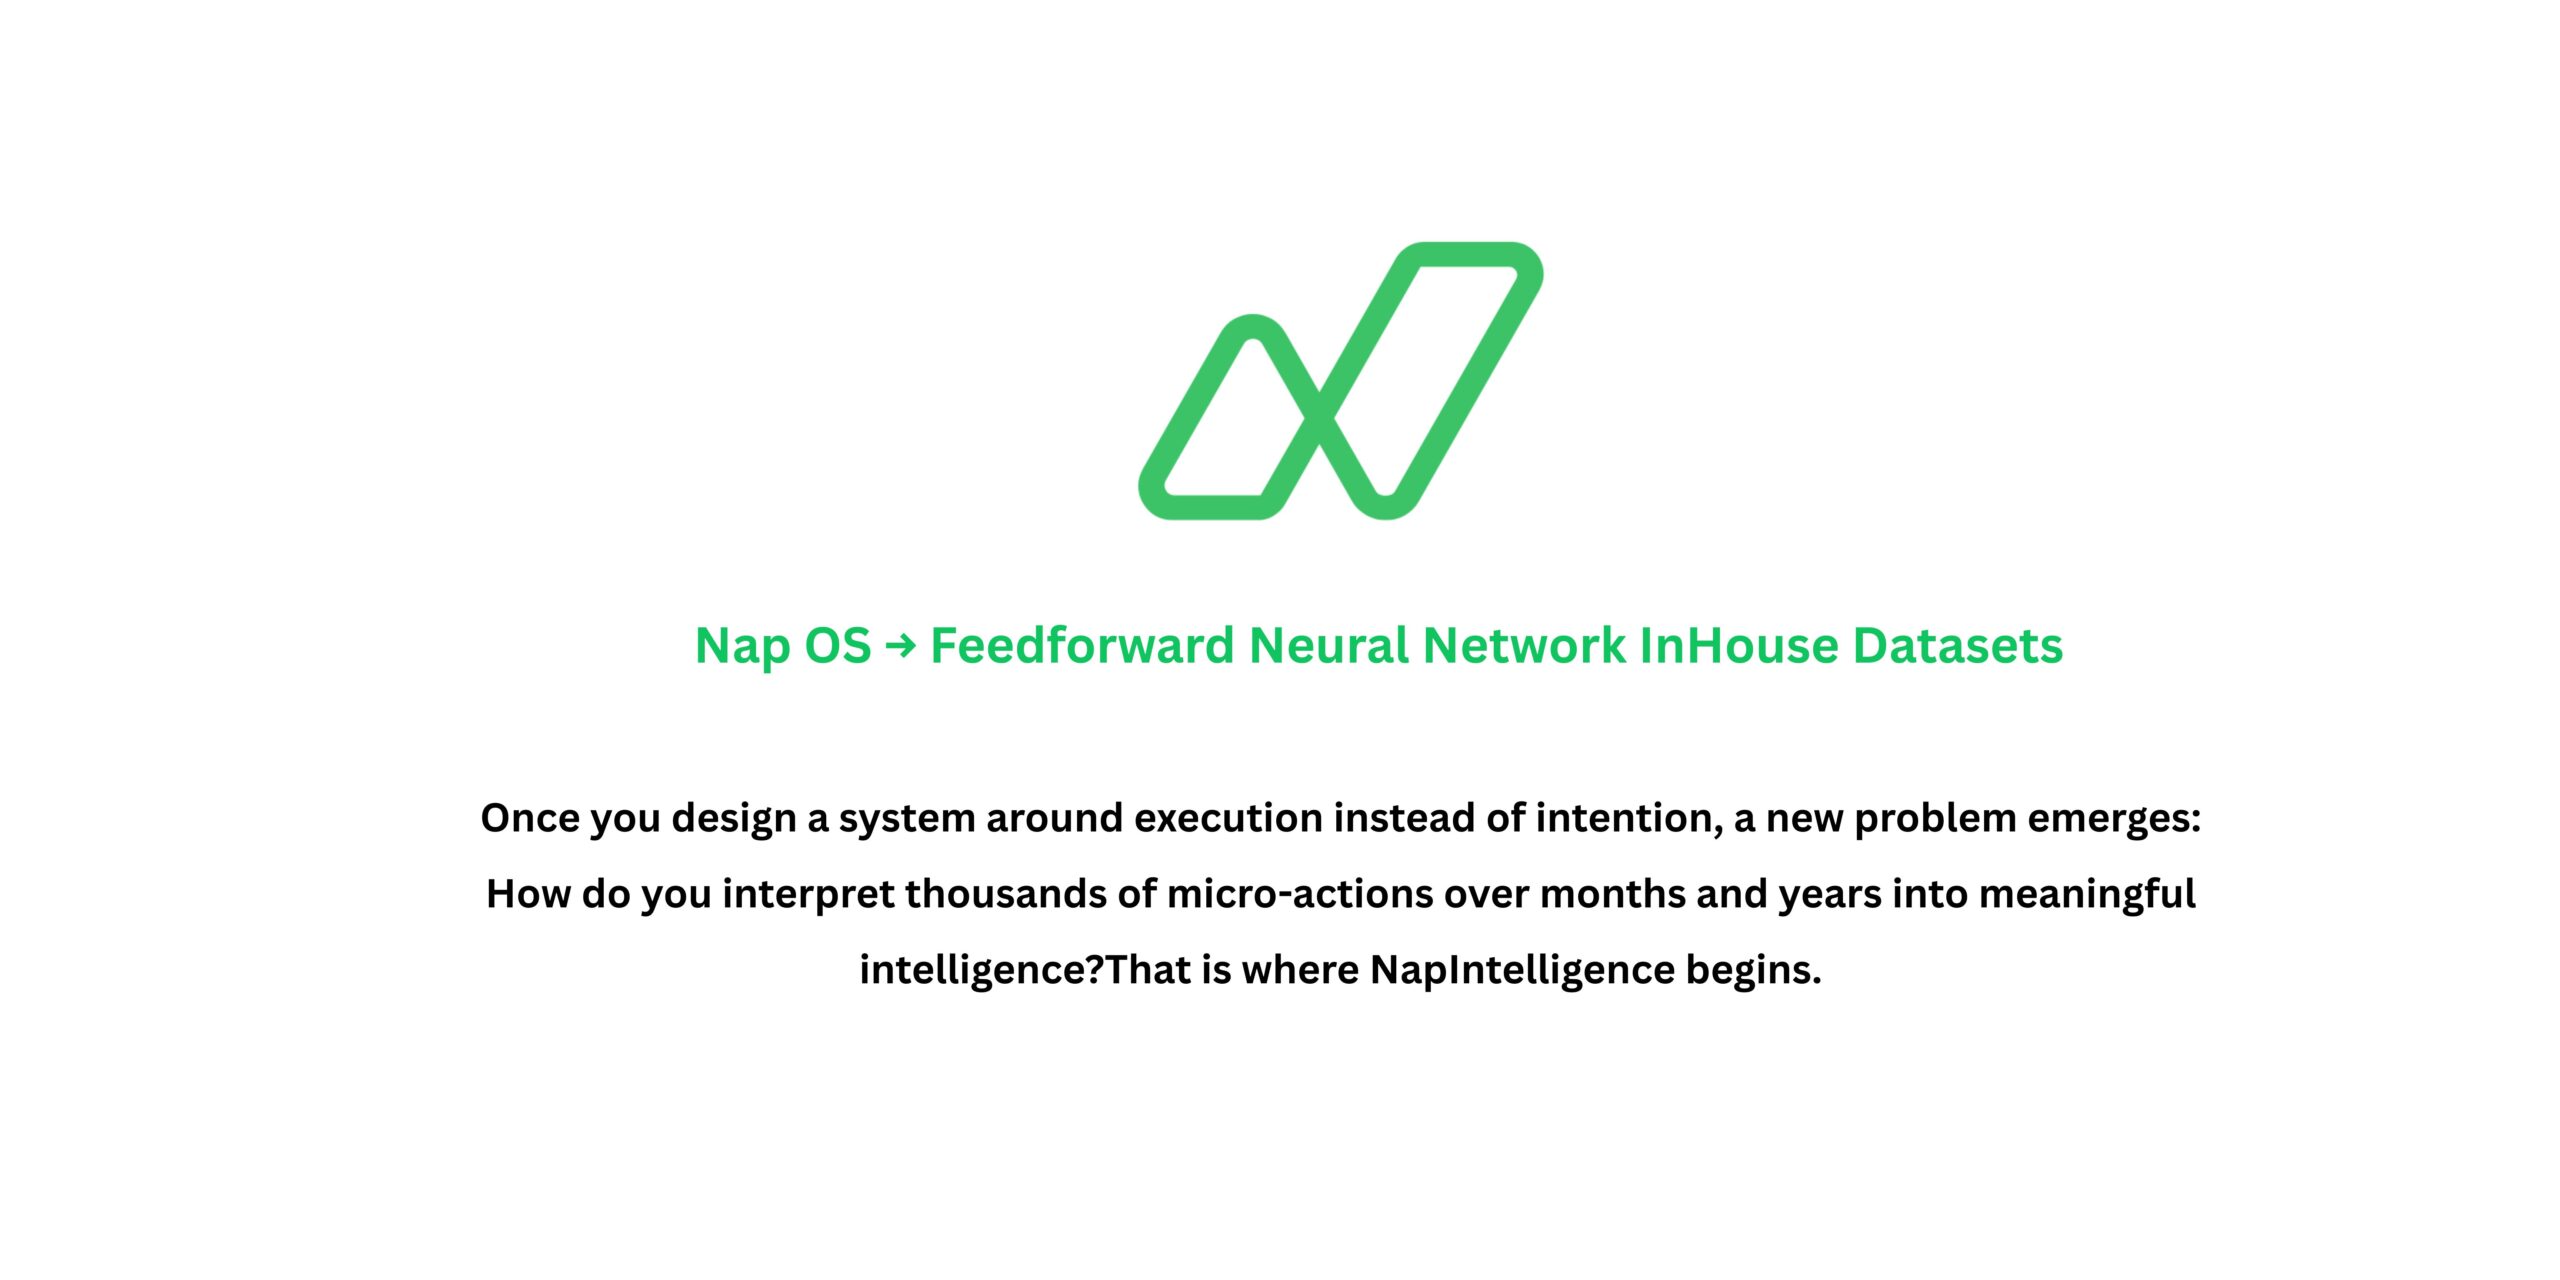
Nap OS Intelligence Backed by feedforward Neural Network for training InHouse datasets
A Public Development Note on Training Intelligence for Long-Horizon Work Most productivity systems fail for one simple reason:they…
More from the Napblog
Blog
Thoughts on building in public, product development, career systems, and the future of human-AI collaboration.
160 articlesAIEOS - AI Europe OS
How AI Europe OS helps startups and SMBs navigate EU regulation, compliance, and infrastructure to build responsible AI businesses.
85 articlesOut of Box Thinking
69 articlesHOS - Homeschooling OS
Building the operating system for homeschooling families â curriculum tracking, skill verification, and personalized learning paths.
64 articlesSIOS - Students Ireland OS
Resources, guides, and stories for students in Ireland navigating education, employment, and career development through technology.
43 articlesIPOS - Intuition Psychology OS
34 articlesPugazheanthi Palani
4 articlesFrom reading to doing.
Every insight in this archive was born from real execution. Nap OS is where you make it happen.