Last updated: February 17, 2026
5 min read
Why Heatmaps Became the Center of Napblog’s Marketing Decisions
January 2026 marked a defining phase for Napblog’s website marketing maturity. Traffic volumes were still modest, but behavioral signals were exceptionally rich. Instead of relying on vanity metrics—pageviews, impressions, or raw sessions—Napblog deliberately anchored its entire website optimization strategy around heatmaps, session recordings, and real user behavior analytics.
This article presents a full-stack, execution-level breakdown of how a modern business should use heatmap intelligence to:
- Optimize on-page SEO and UX
- Strengthen off-page signals and acquisition quality
- Build a continuous optimization loop, not a one-time audit
This is not theory. It is a practical, operational framework derived directly from Napblog’s January 2026 data.
1. Understanding Heatmaps as a Business Intelligence Layer
Heatmaps are often misunderstood as design tools. In reality, they are decision-validation systems.
Napblog used four primary behavioral data layers:
- Scroll Heatmaps – How far users actually consume content
- Click Heatmaps – Where intent concentrates (and where it doesn’t)
- Session Recordings – How real humans behave, hesitate, or abandon
- Performance Metrics Overlay – How UX friction correlates with SEO loss
Together, these layers expose truth, not assumptions.
2. Scroll Depth Analysis: Content Consumption vs. Content Length
Key Observation (Jan 2026)
- Significant drop-off occurred between 25%–40% scroll depth
- Less than 30% of users reached the bottom of long-form pages
- Critical CTAs placed after 60% scroll were rarely seen
Business Insight
Search engines reward useful content, but users reward structured content. Long content alone does not equal engagement.
On-Page Optimization Actions
- Introduced above-the-fold value clarity (who it’s for, what problem it solves)
- Added content signposting every 20–25% scroll (micro-headlines, visual breaks)
- Repositioned primary CTAs between 20–35% scroll depth
SEO Impact
- Reduced pogo-sticking signals
- Improved average engagement time
- Strengthened behavioral relevance signals used by search engines
Lesson: Scroll depth is not about length—it is about momentum.
3. Click Heatmaps: Intent Mapping vs. Visual Guesswork
Key Observation
- Users clicked repeatedly on non-clickable elements (icons, highlighted text)
- Primary navigation links received fewer clicks than contextual in-content links
- Footer links were almost invisible on mobile
Business Insight
Users do not read interfaces. They probe them.
Click heatmaps reveal where users expect action, not where designers place it.
On-Page Optimization Actions
- Converted high-click non-interactive elements into real links
- Embedded contextual internal links inside content sections
- Simplified navigation hierarchy for mobile users
SEO Impact
- Improved internal link equity distribution
- Increased pages per session
- Reduced bounce rate from misaligned expectations
Lesson: Every dead click is a trust leak.
4. Session Recordings: Diagnosing Invisible Friction
Heatmaps show where. Session recordings show why.
Key Observation
- Users paused excessively before scrolling (hesitation signals)
- Cursor jitter near performance-heavy sections
- Abrupt exits during layout shifts on mobile
Business Insight
SEO penalties increasingly stem from experience degradation, not keyword misuse.
Session recordings exposed:
- Cognitive overload
- Performance friction
- Trust hesitation
On-Page Optimization Actions
- Reduced above-the-fold visual density
- Deferred non-critical scripts
- Stabilized layout to minimize cumulative layout shift (CLS)
SEO Impact
- Improved Core Web Vitals perception
- Stronger engagement signals
- Reduced early-stage exits
Lesson: If a user hesitates, the algorithm notices.

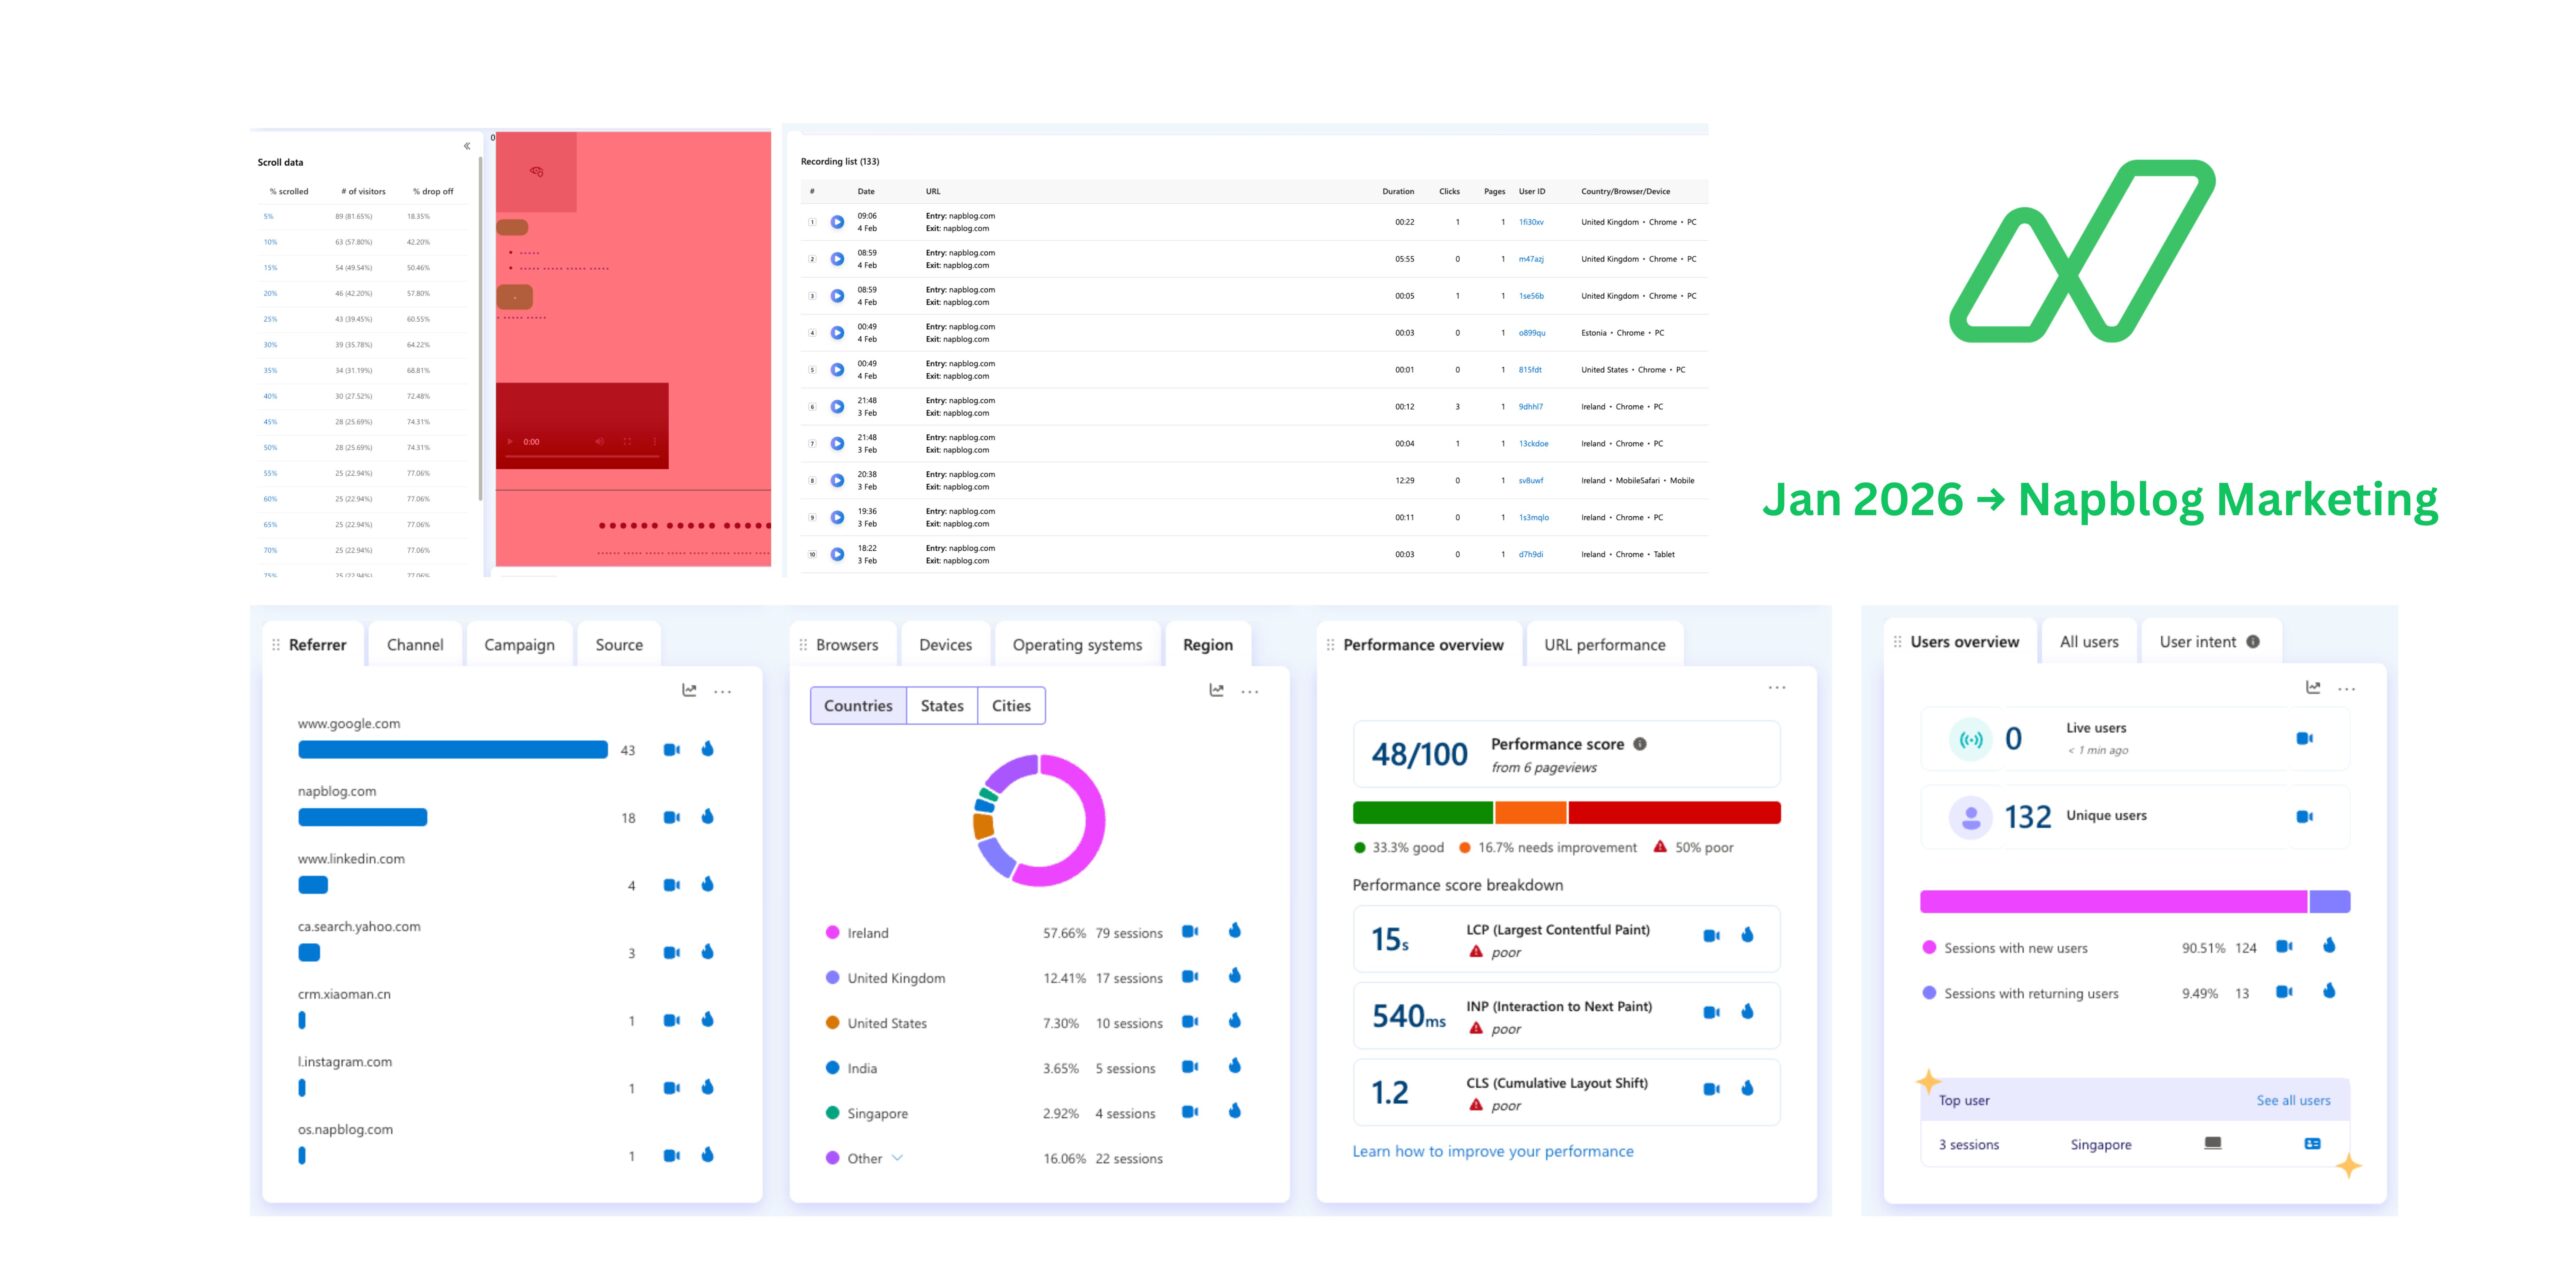
5. Performance Metrics + Heatmaps: When UX Becomes SEO
January 2026 performance overview showed:
- LCP ~15s (Poor)
- INP ~540ms (Poor)
- CLS ~1.2 (Poor)
Correlated Heatmap Findings
- Rage clicks aligned with slow content load zones
- Scroll abandonment occurred before LCP completion
- Mobile users exited earlier than desktop users
Optimization Actions
- Image compression and lazy loading
- Reduced DOM complexity
- Prioritized critical content rendering
Strategic Insight
Core Web Vitals are not abstract scores—they are behavior amplifiers.
Poor performance doesn’t just slow pages; it reshapes user behavior, which feeds directly into ranking systems.
6. On-Page SEO Reframed: Behavior-First Optimization
Napblog’s January approach redefined on-page SEO into five behavior-centric pillars:
1. Intent Clarity
Users must understand the value proposition within 3–5 seconds.
2. Consumption Flow
Content must guide users, not challenge them.
3. Interaction Affordance
If something looks clickable, it must be clickable.
4. Performance Predictability
Pages must feel stable and fast—even before they are fully loaded.
5. Engagement Signals
Scroll, clicks, and dwell time must align naturally.
Result: On-page SEO stopped being “optimization” and became experience engineering.
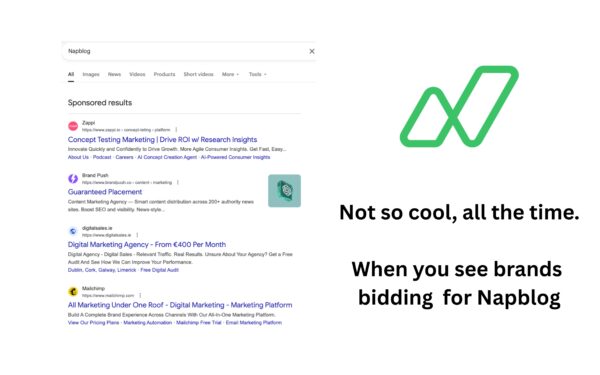
7. Off-Page Optimization: Quality of Traffic Over Quantity
Heatmaps exposed a crucial truth: not all traffic is equal.
Referrer Analysis Insights
- Organic search traffic showed deeper scroll and higher engagement
- Social referrals had shallow engagement but high awareness value
- Direct traffic showed intent-heavy behavior
Off-Page Strategy Adjustments
- Focused link acquisition on contextually aligned platforms
- Avoided high-volume, low-intent referral sources
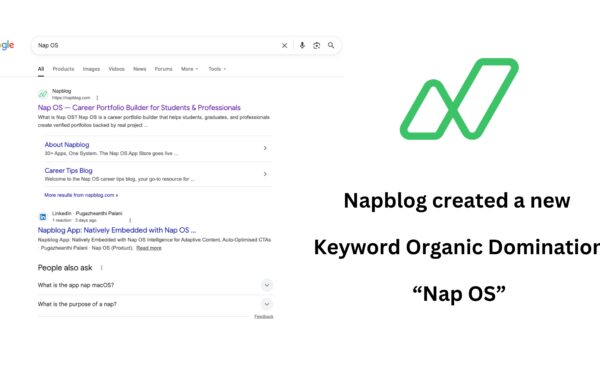
- Strengthened brand-search visibility rather than raw backlinks
Heatmap-Driven Validation
Off-page efforts were validated not by traffic spikes, but by:
- Scroll depth improvement
- Session duration
- Reduced bounce clustering
Lesson: Backlinks without behavioral alignment dilute SEO value.
8. Geographic & Device Insights from Behavioral Data
Key Findings
- Ireland and UK users showed highest engagement depth
- Mobile users exited earlier due to layout instability
- Desktop users explored deeper but clicked less
Strategic Actions
- Mobile-first layout optimization
- Region-specific content nuance
- Device-specific CTA placement
Heatmaps ensured that localization decisions were data-driven, not assumption-driven.
9. Continuous Optimization: From Monthly Reports to Live Feedback Loops
The most important shift Napblog made was operational, not technical.
Old Model
- Monthly SEO audits
- Quarterly UX redesigns
- Lagging KPIs
New Model (Jan 2026)
- Weekly heatmap reviews
- Continuous micro-iterations
- Behavior-led prioritization
Optimization Loop
- Observe behavior
- Identify friction
- Implement change
- Re-observe impact
- Repeat
This loop transformed the website into a learning system, not a static asset.
10. How Any Business Should Apply This Framework
Step-by-Step Blueprint
- Instrument Properly
- Heatmaps, session recordings, performance metrics
- Stop Guessing
- Let behavior invalidate opinions
- Prioritize Friction, Not Features
- Fix what blocks users before adding more content
- Align SEO with UX
- Rankings follow satisfaction, not manipulation
- Commit to Continuity
- Optimization is a system, not a campaign
Conclusion: Heatmaps Are the New SEO Compass
Napblog’s January 2026 website marketing proves a critical reality:
Search engines don’t rank websites.
They rank user satisfaction at scale.
Heatmaps translate abstract SEO advice into observable human behavior. They reveal where trust breaks, where intent fades, and where opportunity hides.
For any modern business, the path forward is clear:
- On-page optimization must start with behavior
- Off-page optimization must attract the right users
- Continuous tracking must replace static reporting
In 2026 and beyond, the winners will not be those who “optimize for Google,” but those who optimize for humans—and verify it relentlessly.
Heatmap-driven website marketing analysis reveals what users actually do on your site. Follow Napblog on LinkedIn.